Hello ILL readers, I hope you all are doing great and holding strong during this bloodbath in the crypto market. It was not something unexpected, in fact, I was forecasting this BTC move with our community members for months on our Lambo Gang telegram channel. If you are a Lambo Letters Subscriber, you already have access to our telegram community and must be learning a lot of new things every day and are way ahead than the 90% of the market contestants.
Let’s go step by step and analyse what has happened in BTC and what we can expect to happen in the coming weeks and months.
BTC has broken its 4-month range to the downside!
As you can see in the chart attached below, BTC was consolidating in a range for the past 120 days, which got broken to the downside a few days back.
It was a move of 24% from the previous swing high at $63.9k price level.
This was pretty much expected as our primary wave count based on Elliott Waves had been suggesting this move for months. Additionally, there was significant sell-side liquidity below the $56.9k level, and as we know, price always moves towards liquidity, resulting in this recent move to the downside.
Such moves are pretty much normal in crypto, if you check history, there have been even larger corrections in the previous bull seasons of 2017 & 2021.
Checkout the below attached X post to read more about previous bull market data, my price forecast of the current crypto cycle top and other bull market related fun facts.
Coming back to our analysis, many short positions have now opened at the $70k - $73k levels, creating a lot of buy-side liquidity. Therefore, the price should go upwards to target those highs, resulting in a rally to the upside.
Price will go up sooner or later, but the main question is whether the bottom is already in or not.
We can’t be certain of anything in the markets, but we can analyze charts, perform technical analysis, narrow down the infinite possibilities into a few most probable outcomes, and be prepared for all of them.
Elliott Wave methodology provides us with powerful analysis and forecasting tools that we can utilize to identify these scenarios.
BTC Elliot Waves Analysis
HTF Primary Analysis
Price topped in wave 3, and then wave 4 began to unfold. This wave 4 developed in three sub-waves (a), (b), and (c). Wave 4 is almost complete, and we are in the final stages of wave (c) of the higher degree wave 4. Wave (c) is unfolding in an ending diagonal in 5 lower degree sub waves.
The next support levels for wave 4 are $55,177 and $49,415. Price can reach the lowest support in this wave 4 and still not be bearish for BTC.
To maintain the bullish scenario, the price should not sustain a break below the $49,000 level.
After completing wave 4, BTC should rise in wave 5. We can determine the target for wave 5 once wave 4 correction is over and a low is established.
The HTF secondary scenario is that the lowest support level won't hold, and the price will go much deeper, which I don't think will happen. If you want me to share this scenario, let me know in the comment section.
LTF Primary scenario
Wave (c) is unfolding in a 5 waves diagonal structure and we are currently in the final wave V of this diagonal.
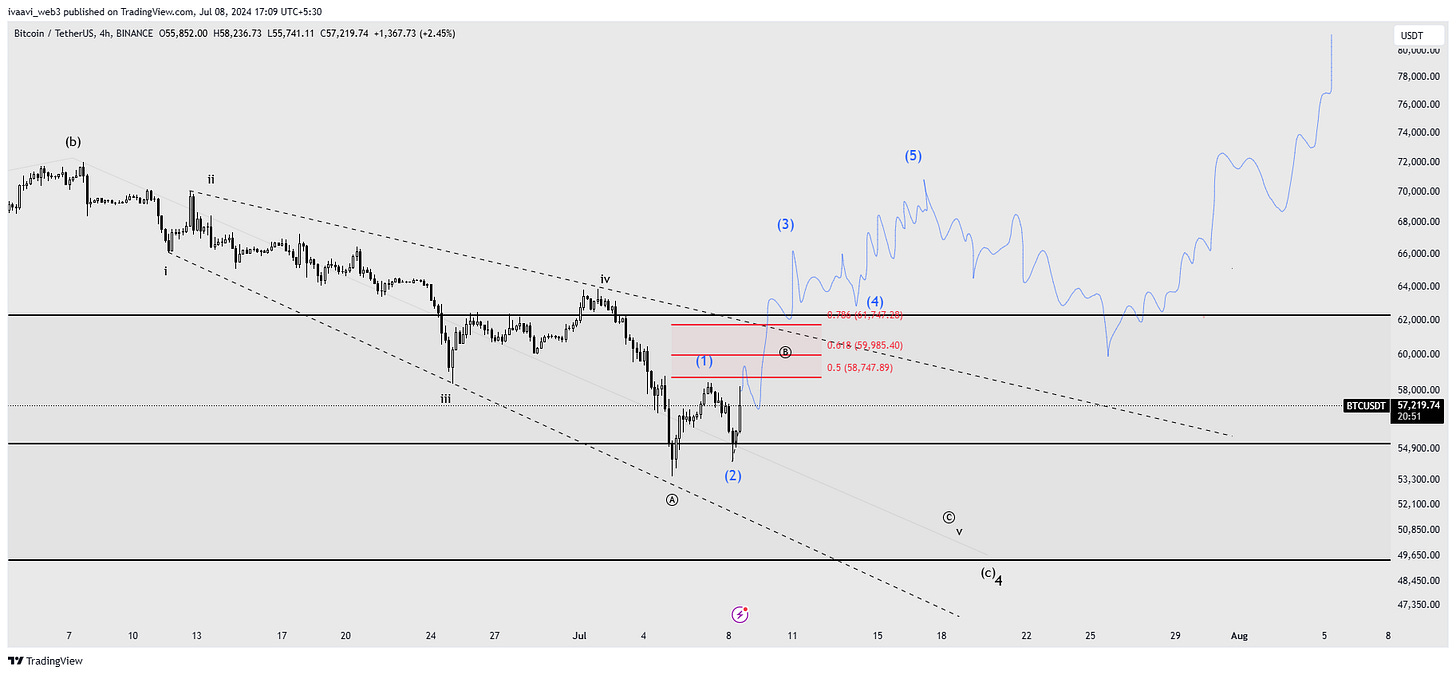
Every sub-wave of the diagonal structure is corrective and unfolds in three waves. Wave V is also unfolding in three waves: A, B, and C in circles. The target for circled wave B is in the red target zone between $58.7k and $61.7k. After completing circled wave B, the price should drop below the previous swing low of $53.5k, making a new low, taking out the sell-side liquidity of all the long positions, and completing circled wave C and concluding wave 4 correction with this move.
Price will shoot higher in wave 5 and make new ATH, taking us to 90k level as discussed in the X post shared above.
LTF Secondary scenario
Structurally, all five waves of the diagonal in wave (c) are complete, suggesting that the low is already in place. The secondary scenario indicates that the low is established, and we are now moving higher.
The price will form five waves to the upside, breaking the previous swing high at $63.8k. After completing these five waves, the price will retrace in three waves before continuing higher, as projected by the blue doodle in the image below.
But after getting out of a 4 month’s consolidation period, price might take some time before regaining those >60k levels. That’s why this is not my primary scenario.
For frequent updates, stay tuned to our Lambo Gang Telegram Channel. Additionally, all chart analysis is publicly available our website web3.ivaavi.xyz
That’s all for the Bitcoin Analysis, I hope it helps.
Thanks for reading,
Ivaavi


